

17.09.2019
Flexport Research: The Sudden Impact of Tariffs on U.S. Imports from China


Flexport Research: The Sudden Impact of Tariffs on U.S. Imports from China
As trade tensions heighten between the United States and China, it can seem as though the conflict has been going on for years. A new, updated data set from Flexport, however, shows a different story: A compressed timeline with dramatic impact.
The key takeaway: The picture is becoming more worrisome. Businesses that survived 2018 and thought they were in the clear might actually not be out of the woods. Understanding how the analytics are trending can help inform business planning and forecasting as the tariff wars rage on.
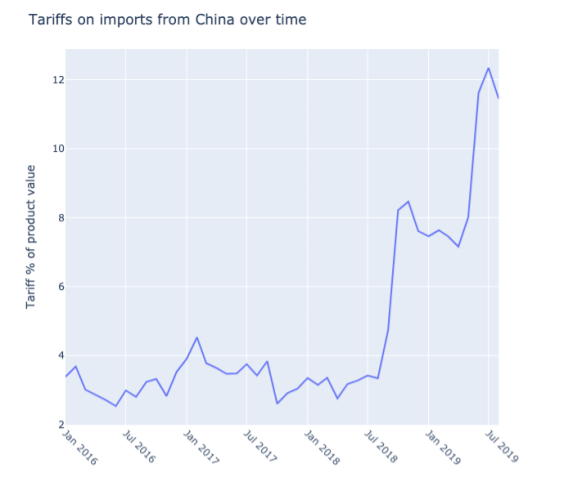
The snapshot above depicts Flexport monthly data as the tariffs have rolled out on China trade. Drilling down into a subset of Flexport shipments, we examined only those categories for which positive tariffs were paid for at least one period. While the sample is not necessarily representative of overall U.S. imports from China, it does cover a broad range of categories. Shipment volumes in each category varied across the time period.
©Flexport, 2019.
Specifically, the snapshot presents tariffs paid as a fraction of product value for a subset of goods shipped with Flexport from the People’s Republic of China to the United States, from January 2016 through August 2019.
While the tariffs in response to an intellectual property investigation (Section 301) are the largest and have grabbed the headlines, the tariffs depicted here cover the full gamut of sources, including antidumping, countervailing duty, and safeguard actions. For example, imports of steel from China have been subject to a number of anti-dumping duties, were then included in the Section 232 national security tariffs of March 2018, and then were also included in the Section 301 intellectual property tariffs that started in July 2018.
What the Data Reveals
While there has been aggressive talk about U.S.-China trade for quite some time, it was only about a year ago that tariffs really started to jump. One persistent economic question has been why we have not seen more of a trade war impact on U.S. economic performance. Despite the long roots of the commercial conflict with China and the prominence of the question in the 2016 campaign, the bulk of the tariffs really hit later.
That delayed impact reveals a few insights into the behavioral responses of shippers.
- If everyone shipped the same shipment contents every month, this should look like a staircase (albeit a pretty steep one at the end). Instead, we see wiggles and slopes.
- While seasonal and compositional factors would likely result in some movement, another interpretation suggests that downward trends show a shift from shipping products hit with higher tariffs toward products with lower or no tariffs. Assuming that to be the case, businesses that are tied to goods with high tariffs could likely feel a significant impact.
Extrapolating further, the graph gives some idea of the potential impact of the tariffs enacted September 1.
The spikes depicted in the graph come from:
- List 1 tariffs in July 2018 (25% on $34B),
- List 2 tariffs in August 2018 (25% on $16B)
- List 3 tariffs in September 2018 (10% on $200B) which increased again in May 2019 (to 25% on the same $200B).
The graph includes data right up until the eve of the latest tranche of tariffs, List 4a, which went into effect on September 1. Those 15% tariffs cover roughly $112bn of goods – a significant broadening on what we have seen so far.
Flexport recommends businesses keep the following in mind as they make supply chain decisions and plan their shipments:
- There are likely more tariffs to come, which will make this curve even steeper. Unless negotiations succeed, tariffs hikes are scheduled for October 15 and then December 15.
- When all the new tariffs are in place, they will cover almost all imports from China; some at the 15% level and some at the 30% level. This will make it substantially harder to change product categories to avoid tariffs--a practice in which some companies have sought to modify their products to qualify for a lower-tariff category.
- So far, there is little sign of tariffs being applied as prolifically to other countries in the region. This means that a product’s official country of origin – not necessarily where most of the work is done – can make a big difference in tariff obligations. It is worth consulting a customs professional to check the rules, as they vary by product.
Editor’s Note: This research is made available for informational purposes only. We do not guarantee, represent or warrant any of the statements in this blog because they are based on our current beliefs, expectations and assumptions, about which there can be no assurance due to various anticipated and unanticipated events that may occur. Neither Flexport nor its advisors or affiliates shall be liable for any losses that arise in any way due to the reliance on the contents contained in this blog.
About the Author


More From Flexport
![Front Photo - What You Need to Know About the New Digital Product Passport Under the EU Ecodesign Act]()
Blog
What You Need to Know About the New Digital Product Passport Under the EU Ecodesign Act
![Ocean Freight Booking Management HERO- update]()
Blog
Take Control of Ocean Freight Bookings, Allocations, and Contracts with Flexport's Upgraded Booking Management Service
![Refugee Day: Klabu]()
Blog
World Refugee Day: Addressing Climate-Driven Displacement Through Sustainable Supply Chains


