Market Update
Freight Market Update: February 29, 2024
North America vessel dwell times and other updates from the global supply chain | May 17, 2023
Freight Market Update: February 29, 2024


Trends to Watch
[Air - Global] (Data Source: WorldACD/Accenture)
- Strong Surge in Tonnages at Asia-Europe Sea-Air Hubs: Recent weeks have seen a notable increase in air cargo volumes at key Asia-Europe sea-air hubs such as Dubai, Colombo, and Bangkok, driven by shippers seeking alternatives to container shipping disruptions due to attacks on ships in the Red Sea. This surge is attributed to the need to replenish European stocks affected by longer container ship voyages around the Cape of Good Hope.
- Significant Year-on-Year Growth: Analysis highlights a year-on-year increase in air cargo tonnages to Europe from Dubai (+71%), Colombo (+61%), and Bangkok (+58%) in the first seven weeks of 2024, significantly outpacing growth at other hubs like Singapore and Doha.
- Impact of Lunar New Year Timing: The later occurrence of Lunar New Year (LNY) in 2024 complicates week-by-week comparisons but underscores a clear pattern of increased tonnages from these hubs to Europe. Despite this, the impact on pricing remains uncertain due to various factors, including market-wide declines from the previous year.
- Seasonal Demand Fluctuations: Post-LNY, a traditional decline in demand from Asia Pacific is observed, affecting global air cargo tonnages and rates. However, there's a structural improvement in demand compared to the previous year, with specific regions like the Middle East & South Asia experiencing tonnage and rate increases, likely reflecting the shift from ocean freight to sea-air solutions.
- Global Air Cargo Trends: Overall, despite a slight year-on-year decrease in worldwide tonnages for weeks 6 and 7, structural improvements in demand levels are evident. Notably, worldwide air cargo capacity has increased, with significant rises from Asia Pacific and Middle East & South Asia, indicating a robust recovery and adaptation within the air cargo industry to ongoing logistical challenges.
[Ocean - ISC to North America]
- Rates: Reduced down after the 2H February GRI. Carriers had initially posted a March 1st GRI of $1000/container, but as of this week have postponed it until 2H March. Without any changes to the market it is likely the GRI will be canceled entirely.
- Space: Vessels delayed getting to destination and back to origin are resulting in a lack of capacity. The short term disruption is expected to be more challenging, while longer term we expect some normalization due to new builds, faster vessel speeds, and implementation of idle capacity.
- Equipment: Although equipment availability is carrier-specific for each port of loading, the overall situation is challenging. This is especially true at inland container depots and smaller/less connected ports.
[Ocean - FEWB]
- Red Sea: This remains unresolved as most vessels continue to reroute via the Cape of Good Hope, adding 2-4 weeks of transit time (round trip). Vessel schedules will continue to fluctuate as a result, and regional equipment shortages will occur in some Asian ports.
- Demand: Demand has softened as expected after the LNY holiday. Bookings have slowed down in week 9; we expect them to pick up from week 11 onwards. As roll pools have been created in the past few weeks, vessel utilization is positive at the moment, and carriers are continuing to assess capacity and rates.
- Capacity: All alliances implemented massive blank sailings pre-LNY for weeks 8 and 9, which cut about 30+% of capacity on average. After the LNY holiday, Ocean Alliance announced two more void plans for March. If demand remains flat, there might be more blank sailings to be announced. Occasional space constraints due to smaller vessel deployment and schedule re-shuffling due to current re-routing will also impact the available capacity each week.
- Rate Development: As the Red Sea situation continues to impact capacity and equipment, carriers are upholding rates via GRI / PSS / Contingency Charges, however there’s pressure and questions about the amount of additional costs of re-routing via Cape of Good Hope. Expectations are that the Peak Season quantums will be mitigated or even be dropped in March. Rates are expected to go down as of March 1 and continue to decline going forward due to low demand.
Please reach out to your account representative for details on any impacts to your shipments.
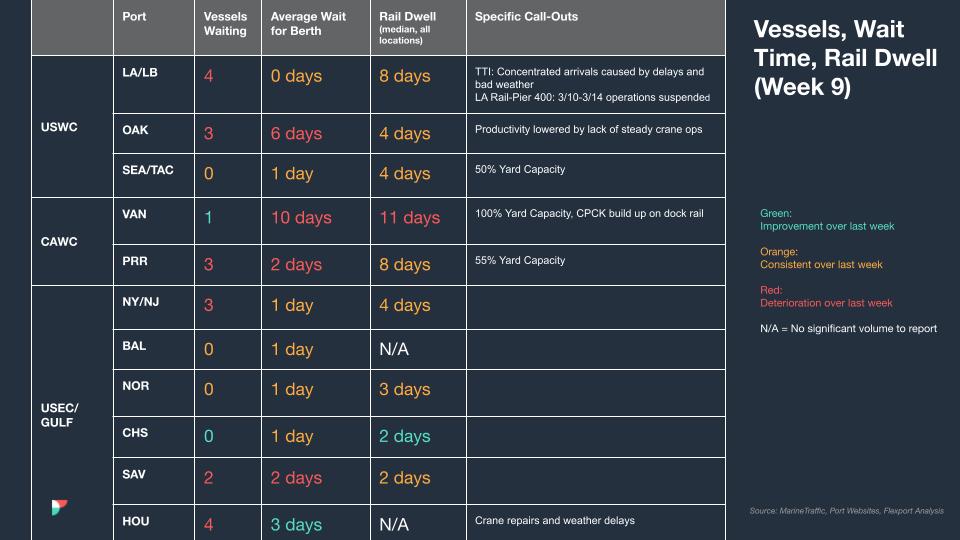
North America Vessel Dwell Times
Webinars
European Freight Market Update Live
Tuesday, March 5 at 15:00 GMT / 16:00 CET
North America Freight Market Update Live
Thursday, March 14 at 9:00 AM PT / 12:00 PM ET
European Demo
Thursday, March 14 at 10:00 GMT / 11:00 CET
New! Flexport Ocean Timeliness Indicator
Due to ongoing global shipping events in the Panama and Suez Canal, we have refined our previous report by splitting the Transpacific Eastbound trade lane into two subtradelanes: TPEB to the U.S. West Coast, and TPEB to the U.S. East Coast.
Ocean Timeliness Indicators for China to Northern Europe and China to U.S. East/West Coast Stabilize
Week to February 26, 2024
This week, the OTI from China to Northern Europe due to the Suez Canal Crisis remains high above 60 days. We anticipate these transit times have begun to normalize at these new highs as vessels sail around the Cape of Good Hope. The OTI for the China to U.S. East Coast remains steady at 59 days as does the OTI for China to the U.S. West Coast at 37 days.
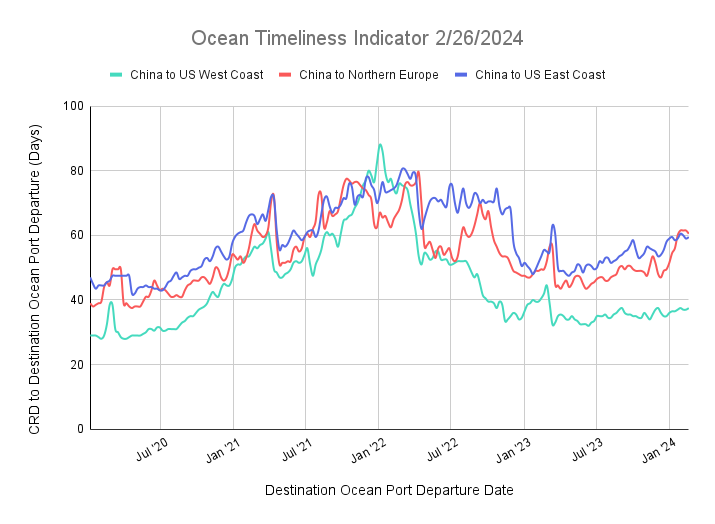
The Methodology: The Flexport Ocean Timeliness Indicator (OTI) utilizes data from Flexport’s ocean shipping operations for an expansive view of a container’s journey. Updated on a weekly basis, the Flexport OTI shows the time taken to transit from the Cargo Ready Date at the exporters’ gate to the Destination Port Departure date when products are ready to leave port to go to importers. The ocean shipping world tends to run along “trade lanes.” The three biggest trade lanes carry goods from China to the U.S. West Coast of North America, China to the U.S. East Coast of North America, and from China to Northern Europe. The OTI captures the timeliness of each of these. To show the most realistic picture, the OTI will exclude premium services and will utilize a trailing two-week approach.
The contents of this report are made available for informational purposes only. Flexport does not guarantee, represent, or warrant any of the contents of this report because they are based on our current beliefs, expectations, and assumptions, about which there can be no assurance due to various anticipated and unanticipated events that may occur. Neither Flexport nor its advisors or affiliates shall be liable for any losses that arise in any way due to the reliance on the contents contained in this report.
About the Author


