Market Update
Freight Market Update: April 4, 2024
North America vessel dwell times and other updates from the global supply chain | May 17, 2023
Freight Market Update: April 4, 2024
Trends to Watch
[Ocean - FEWB]
- Asia-Europe: The Red Sea situation continues to impact freight market development. Vessels continue rerouting via the Cape of Good Hope and vessel schedules continue fluctuating.
- Demand remains flat but is picking up. The Economic Sentiment Indicator for the Eurozone in March stood at 96.3, surpassing both the previous value and market expectations. With Labor Day approaching, there will be a long holiday in Mainland China. Production may be impacted, so expect bookings to increase in late April and slow down in the first week of May.
- General Rate Increases (GRI) were implemented by carriers to keep rates from dropping further. After a 9-week continuous drop, the latest Shanghai Containerized Freight Index (SCFI) increased by $51/TEU for week 14. Most of the carriers successfully pushed for a GRI in the 1st half of April. With most vessels projected to be full, expect another round of GRI for the 2nd half of April, as there are around 2 million TEU of new capacity for delivery in the coming months. Most of the capacities are mega ships where Asia-Europe trade will be the primary option. Expect GRI to be on and off in the coming months until all new ships are available.
- For historical updates on the Red Sea situation, read more in Global Ocean Carriers Halt Red Sea Transits - What to Expect.
[Air - Global] (Data Source: WorldACD/Accenture)
- Air cargo rates have increased globally, particularly from Asia Pacific and Middle East & South Asia (MESA), driven by disruptions in container shipping and a high demand for cross-border e-commerce shipments, with average global rates up by around +3% in week 12 to $2.45.
- Despite a slight decrease in global tonnages (-2%) in week 12 compared to the previous week, there was a +1% increase in tonnages and a +6% increase in average rates over the last two weeks compared to the prior period, with notable rate increases from MESA (+10%) and Asia Pacific (+7%).
- Year-on-year data shows significant improvements in demand, with global tonnages up by +8%, led by rises from MESA (+15%) and Asia Pacific (+12%), amid continued disruptions in Asia-Europe container shipping and strong e-commerce demand.
- Air cargo capacity has significantly increased over the last year (+9% globally), especially from Asia Pacific (+19%) and Central & South America (+12%), while average rates remain above pre-COVID levels, despite a year-on-year decrease.
- Notable regional highlights include a surge in demand and rates from MESA, with YoY tonnage up +15% and rates up +29% in weeks 11 and 12, and significant increases in air freight traffic from the Eastern Mediterranean to MESA due to container shipping disruptions, with Athens and Istanbul experiencing notable growth in tonnages to Dubai.
Please reach out to your account representative for details on any impacts to your shipments.
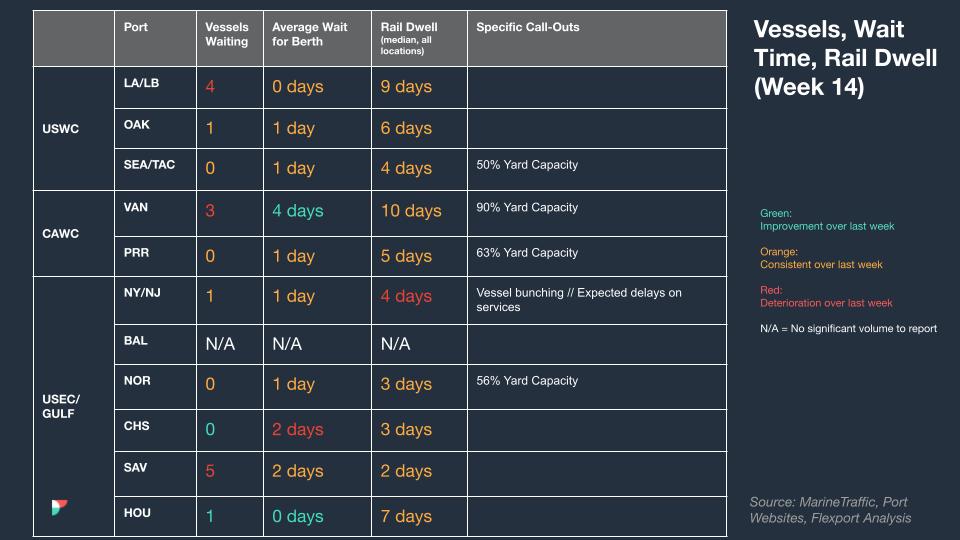
North America Vessel Dwell Times

Webinars
North America Freight Market Update Live
Thursday, April 11 at 9:00 AM PT / 12:00 PM ET
Flexport Ocean Timeliness Indicator
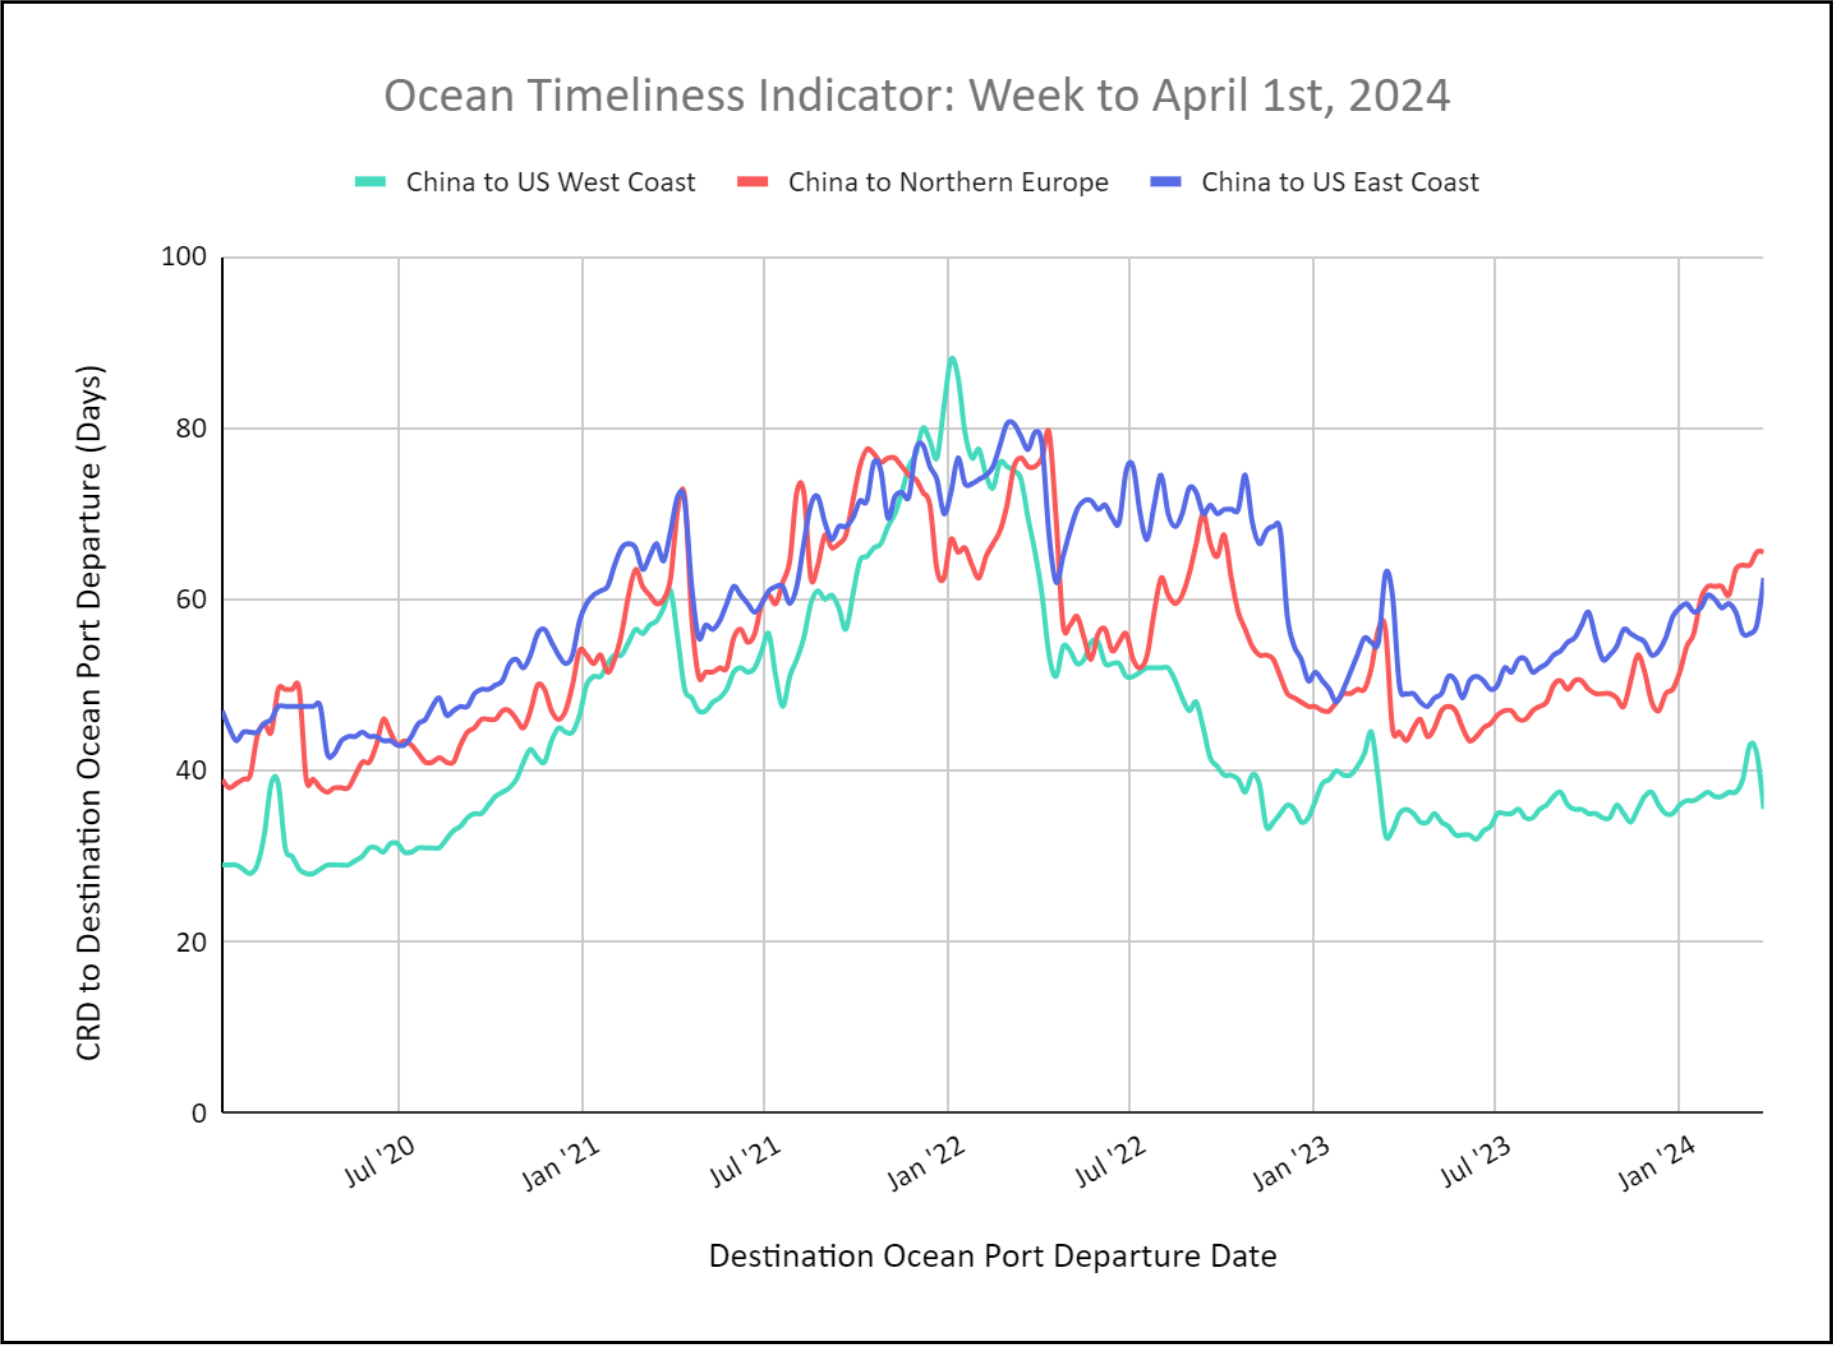
Ocean Timeliness Indicators for China to U.S. West Coast Decrease, While China to U.S. East Coast Increases.
Week to April 1, 2024
This week, the OTI for China to Northern Europe remained steady at 65 days due to carrier re-routings from the Suez Canal around the Cape of Good Hope. The OTI for China to the U.S. East Coast also remains elevated significantly to 62 days as some carriers route westward around Cape of Good Hope. Most have decided to use the Panama Canal despite continued slot restrictions. The OTI for China to the U.S. West Coast decreased to 36 days after a previous increase.

Please direct questions about the Flexport OTI to press@flexport.com.
See full report and read about our methodology here.
The contents of this report are made available for informational purposes only. Flexport does not guarantee, represent, or warrant any of the contents of this report because they are based on our current beliefs, expectations, and assumptions, about which there can be no assurance due to various anticipated and unanticipated events that may occur. Neither Flexport nor its advisors or affiliates shall be liable for any losses that arise in any way due to the reliance on the contents contained in this report.


